
Physiology Friday #305: My Top 5 Studies from the Endurance World This Month
Heart disease, pre-run protein, baking soda, and more.


Greetings!
Welcome to the Physiology Friday newsletter.
Details about the sponsors of this newsletter and deals on products I love, including Ketone-IQ, Create creatine, Equip Foods, and ProBio Nutrition can be found at the end of the post.
For this week’s newsletter, I wanted to share some summaries of the most interesting studies that I stumbled upon in the last month related to endurance exercise. Most of these first appeared in my other newsletter (Run Long, Run Healthy). I cover:
Data that higher training volumes increase coronary atherosclerosis risk
Money ($) as a performance enhancer
If pre-run whey protein causes GI distress
Why sodium bicarb (baking soda) isn’t that effective
How good are smart watches for measuring sweat rates?
Enjoy!
High-Volume Training Raises Atherosclerosis Risk
There’s a persistent finding in sports cardiology that makes runners (including me) uneasy. Middle-aged and older endurance athletes can show more coronary plaque and higher coronary calcium than similarly healthy non-runners.
A big debate has been why. Is it intensity? Volume? Lifetime exposure?
A new publication from the Master@Heart study tries to tighten that up by using wearable-derived training load.
This was an observational, cross-sectional analysis of 222 men (age 54): 77 lifelong athletes, 98 late-onset athletes, and 47 physically active controls. Training load was quantified in two ways:
Objective wearable-derived training over 12 consecutive months, including duration and heart-rate–weighted intensity. They used eTRIMP (a training impulse metric: duration multiplied by intensity weighting across heart rate zones).
Self-reported training measures.
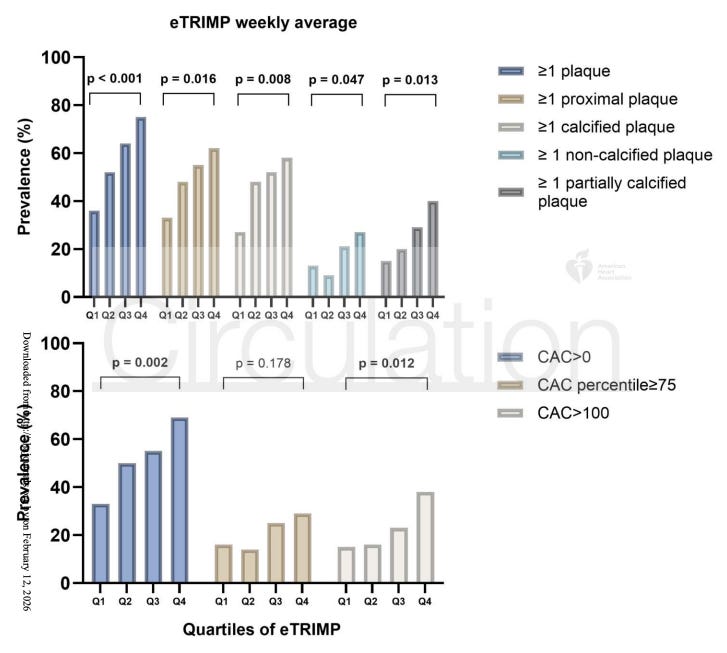
Then everyone underwent coronary CT angiography (CCTA—a clinical imaging procedure used to measure levels of plaque and calcium in the coronary arteries of the heart). The main markers included the presence of ≥1 plaque, coronary artery calcification (CAC > 0), and more clinically concerning calcification (CAC > 100). They compared coronary disease prevalence across training-loads.
The objective wearable data produced a clear gradient: higher objective training load was associated with a substantially higher prevalence of subclinical coronary disease.
Compared with the lowest training load, athletes with the highest training load had a 485% increase in the odds of having ≥1 plaque (and the raw prevalence was 74.5% vs 36.4%); a 403% higher odds of a CAC > 0; and a 250% greater odds of having a CAC > 100.
They also looked at objective training duration. The lowest level was 0.5–3.3 hours/week, and the highest was 9.2–26.5 hours/week. Again, those with more training hours had higher plaque prevalence (70.9% vs 40.0%) and higher odds of plaque and calcified plaque features.
One of the most interesting (and practically relevant) findings was that time spent in higher-intensity zones, by itself, was not clearly associated with coronary disease when separated from duration. The signal was strongest for high duration and for the combined load captured by eTRIMP (which essentially blends duration with cumulative intensity exposure).
This paper also highlights a measurement issue. Self-reported training duration was much weaker as a predictor. Self-reported training load was not meaningfully associated with coronary disease, which supports the idea that wearable-derived metrics may be necessary if we’re going to understand the dose–response relationship between training and coronary plaque.
Practical takeaway
For masters athletes, the headline isn’t “exercise causes heart disease”—it’s that very high weekly training duration (especially when paired with high cumulative load) may be linked to a higher prevalence of coronary plaque and coronary calcium, even in men with otherwise low traditional risk. Treat cardiovascular risk like something you manage alongside performance: know your blood pressure and lipids, don’t ignore family history, and consider a more medicalized check-in if you’re doing consistently high-volume training year after year. And if you’re trying to interpret your own risk, the study also reinforces that objective data (hours, load, intensity distribution) is what seems to map onto the coronary findings, not how much you “think” you train.
Can Money Enhance Your Performance?
Most of us like to think we’re tough because we’re tough. Not because someone dangled a gift card in front of us.
But all of us have run a hard workout better when we had a race on the calendar, a training partner next to us, or even a Strava segment we really wanted. Motivation is part of the engine. But does motivation change fatigue itself, or just how long we’re willing to tolerate the exact same level of exertion?
A new study went straight at that question. A total of 18 healthy young adults (9 women, 9 men; ~23 years old) completed three lab visits. First, they did a test to determine VO₂max and peak power, plus estimate the maximal metabolic steady state (MMSS). Then they completed two identical experimental sessions:
A heavy-intensity cycling time-to-task failure at 95% of estimated MMSS—so hard, but theoretically sustainable for a while.
After 1 minute of rest, they immediately did an extreme-intensity cycling time-to-task failure at 90% of peak power—short, brutal, and heavily dependent on what you have left in the tank.
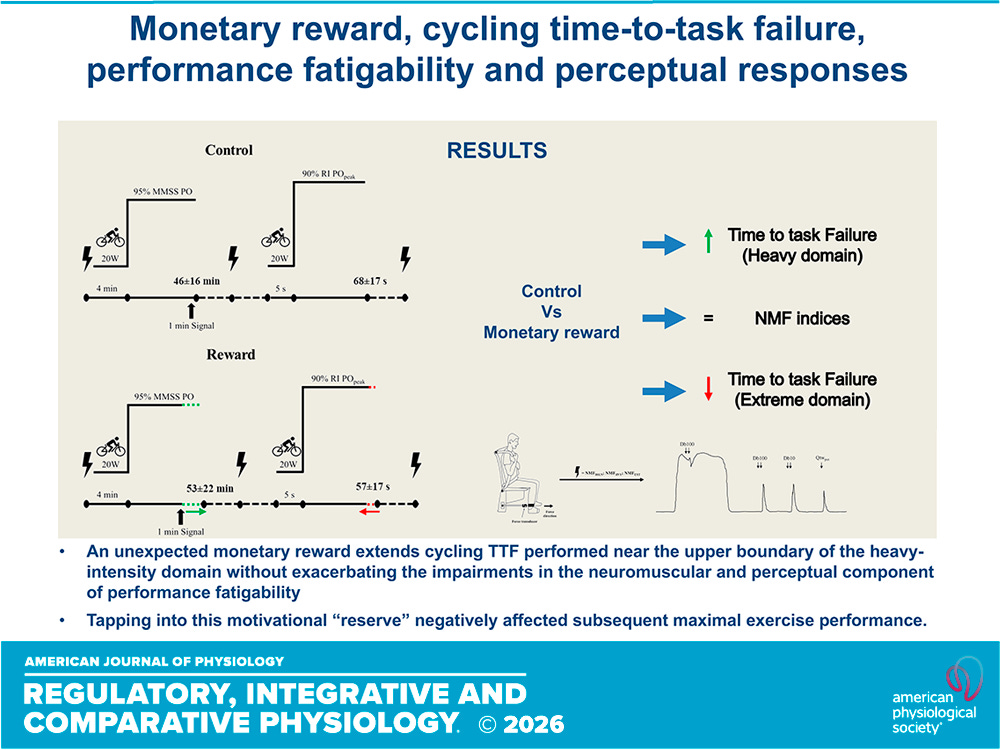
In the second experimental session, participants were kept blinded until they reached the moment when they indicated they were about to stop. At that point, researchers offered them an unexpected monetary reward for continuing: one raffle ticket per additional minute (for a draw to win $250 CAD) and $10 CAD for every additional 5 minutes they kept going.
The incentive did exactly what you’d predict. It didn’t change when people thought they were one minute from quitting, but once money entered the chat, people extended the suffering. Heavy time-to-task failure increased from 46 minutes on average to 53 minutes—roughly a 15% longer ride on average. But the tradeoff showed up immediately in the second test: extreme time-to-task failure dropped from 68 seconds to 57 seconds—about a 16% reduction.
So the reward bought more minutes in the long, heavy domain… but it cost performance in the follow-up all-out effort. That’s a pretty neat demonstration of the pacing/energetic reality underneath “motivation.” There’s a trade-off.
Now the most important part. The authors didn’t just record time. They measured neuromuscular fatigue in the quad muscles of the leg to test whether the muscles or the brain were the true source of the urge to quit.
Across both conditions, the heavy cycling bout produced a big drop in neuromuscular function: maximal force output fell by about 31%. Crucially, those declines were not worse in the reward condition despite the longer time spent cycling. The fatigue profile after the heavy bout looked essentially the same whether people stopped at 46 minutes (without the reward) or pushed to 53 minutes (with the reward).
Furthermore, the reward didn’t meaningfully alter the perceptual profiles (fatigue, pain, effort). People just kept going longer with the same internal experience and a similar neuromuscular endpoint.
Practical takeaway
Physiology sets the stage, but motivation can meaningfully shift how long you’ll operate near your limits. The practical play here is to use motivation strategically—training partners, structured goals, external accountability—when you want to extend tolerance in long threshold-style work, while recognizing the cost. Squeezing out extra minutes today can blunt the quality of the next hard effort if you’re stacking sessions.
Are We Overthinking Pre-Run Protein?
Most runners have internalized (and stressed about) a simple rule that protein before running = GI disaster. So we play it safe with a bagel, banana, maybe a little jam, and save protein for after. Which is fine… until you realize that a lot of training happens in the real world, where you might be squeezing in a moderate-hard run an hour after breakfast, or you’re trying to support recovery without constantly shoving down carbs.
A new study set out to test whether a “moderate” protein intake before a workout actually makes your stomach revolt compared to a low-protein version.
The researchers ran a study with 13 recreational competitive runners (8 women, 5 men) who were selected specifically because they reported at least two chronic exercise-associated GI symptoms at baseline.
Each runner completed two test days separated by a 1–5 week washout. They arrived fasted (10+ hours) for morning testing and drank one of two shakes 1 hour before running: a low-protein whey shake (0.15 g/kg) or a moderate-protein whey shake (0.4 g/kg). Both shakes included roughly the same carbohydrate dose (0.75 g/kg) mixed with water.
For context, using their average body mass of ~65 kg, the low-protein shake worked out to ~9 g protein, and the moderate-protein shake to ~23 g protein, with carbs ~50 g in both shakes. Calories were higher in the moderate-protein condition (~299 kcal vs ~234 kcal) because protein adds energy, and they didn’t reduce carbs to compensate.
The run was performed on a treadmill—10 km at 85% of the runners’ 10K race pace (so not race intensity, but definitely not easy). They also did a standardized warmup and cooldown.
GI symptoms happened… regardless of protein dose. Even though this was “only” a ~1-hour treadmill 10K effort, GI symptoms were extremely common. During the run, 12/13 runners reported at least one symptom in the low-protein condition, and 11/13 in the moderate-protein condition. The number of total symptoms increased from fasting to running in both trials, but the protein dose didn’t meaningfully change the total symptom burden. The most common symptoms during the run were things like belching, fullness/heaviness, side stitches, flatulence, urge to defecate/urinate… basically the runner’s GI starter pack.
The only clear protein-related difference was bloating severity. When they scored symptom severity (0–9 scale), almost everything looked similar between conditions… except bloating. During the run, bloating severity averaged 0.54 in the low-protein trial vs 1.23 in the moderate-protein trial.
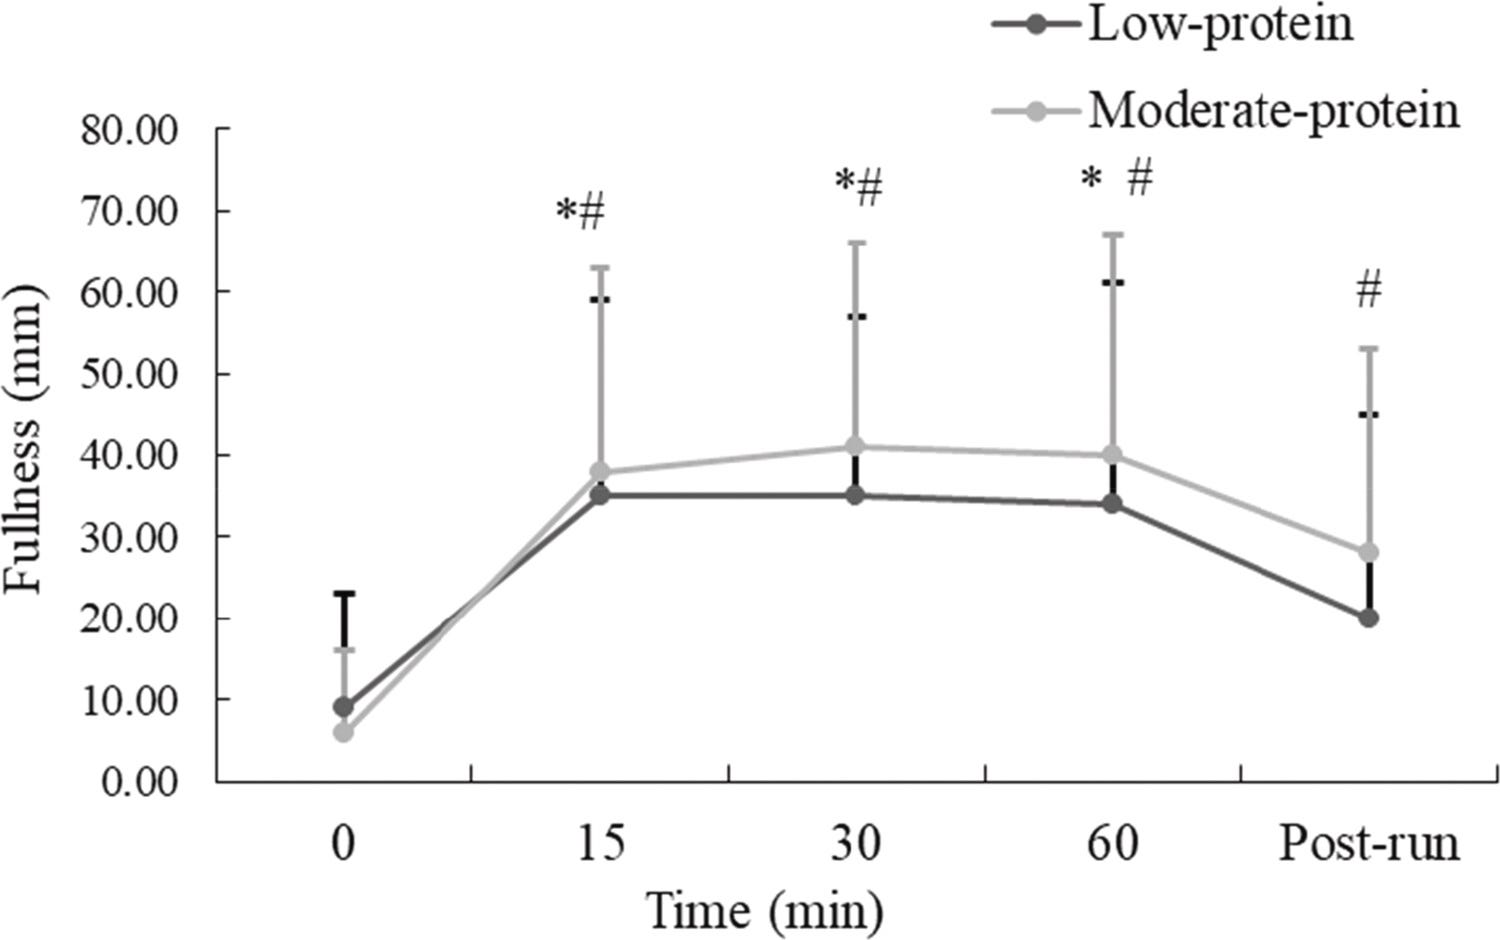
Gut fullness rose after the shake, peaked around 30 minutes, and didn’t differ much between shakes. Statistically, the two conditions weren’t different—but practically, there was a subtle pattern that in the moderate-protein condition, fullness stayed above fasting levels through all time points, including post-run, suggesting protein (or extra calories) may leave that fullness sensation hanging around longer (for better or worse).
Importantly, perceived exertion didn’t change at all—the runners didn’t feel that the run was harder with more protein.
Practical takeaway
If you’ve been avoiding any meaningful pre-run protein out of fear of GI issues, this study should make you a little less anxious about it (at least for whey protein in a shake) if taken an hour before a moderate-hard ~10K effort. Up to 0.4 g/kg (roughly 20–25 g for many runners) didn’t blow up overall GI symptoms, fullness, blood sugar, or how hard the run felt, though it did increase bloating a bit, so it’s not a free-for-all if you’re prone to this symptom. If you want more protein before certain workouts (because it fits your schedule or helps you hit daily targets), trial it on controlled training days first, and if you’re already a GI-sensitive runner, don’t assume you need to zero out protein—start modest, keep the food form easy to digest, and let tolerance dictate your routine.
Can Baking Soda Boost Your Workout?
Sodium bicarbonate is one of those supplements that sounds too good to be true—like you can outsmart fatigue with a simple chemistry trick. Load up on baking soda, buffer lactate production during high-intensity exercise, and perform better. The problem is that running isn’t a lab bench… and bicarbonate has a not-so-minor side effect profile that most runners learn about the hard way.
A new systematic review and meta-analysis set out to answer a very specific (and very runner-relevant) question: Does a single oral dose of sodium bicarbonate actually improve continuous running performance?
The authors searched major databases for randomized, double-blind, placebo-controlled trials and only included studies that tested continuous running performance after one oral dose of sodium bicarbonate. They excluded multi-day loading protocols and excluded repeated-sprint/interval running designs, which helps keep the question specific to a single, hard, continuous run.
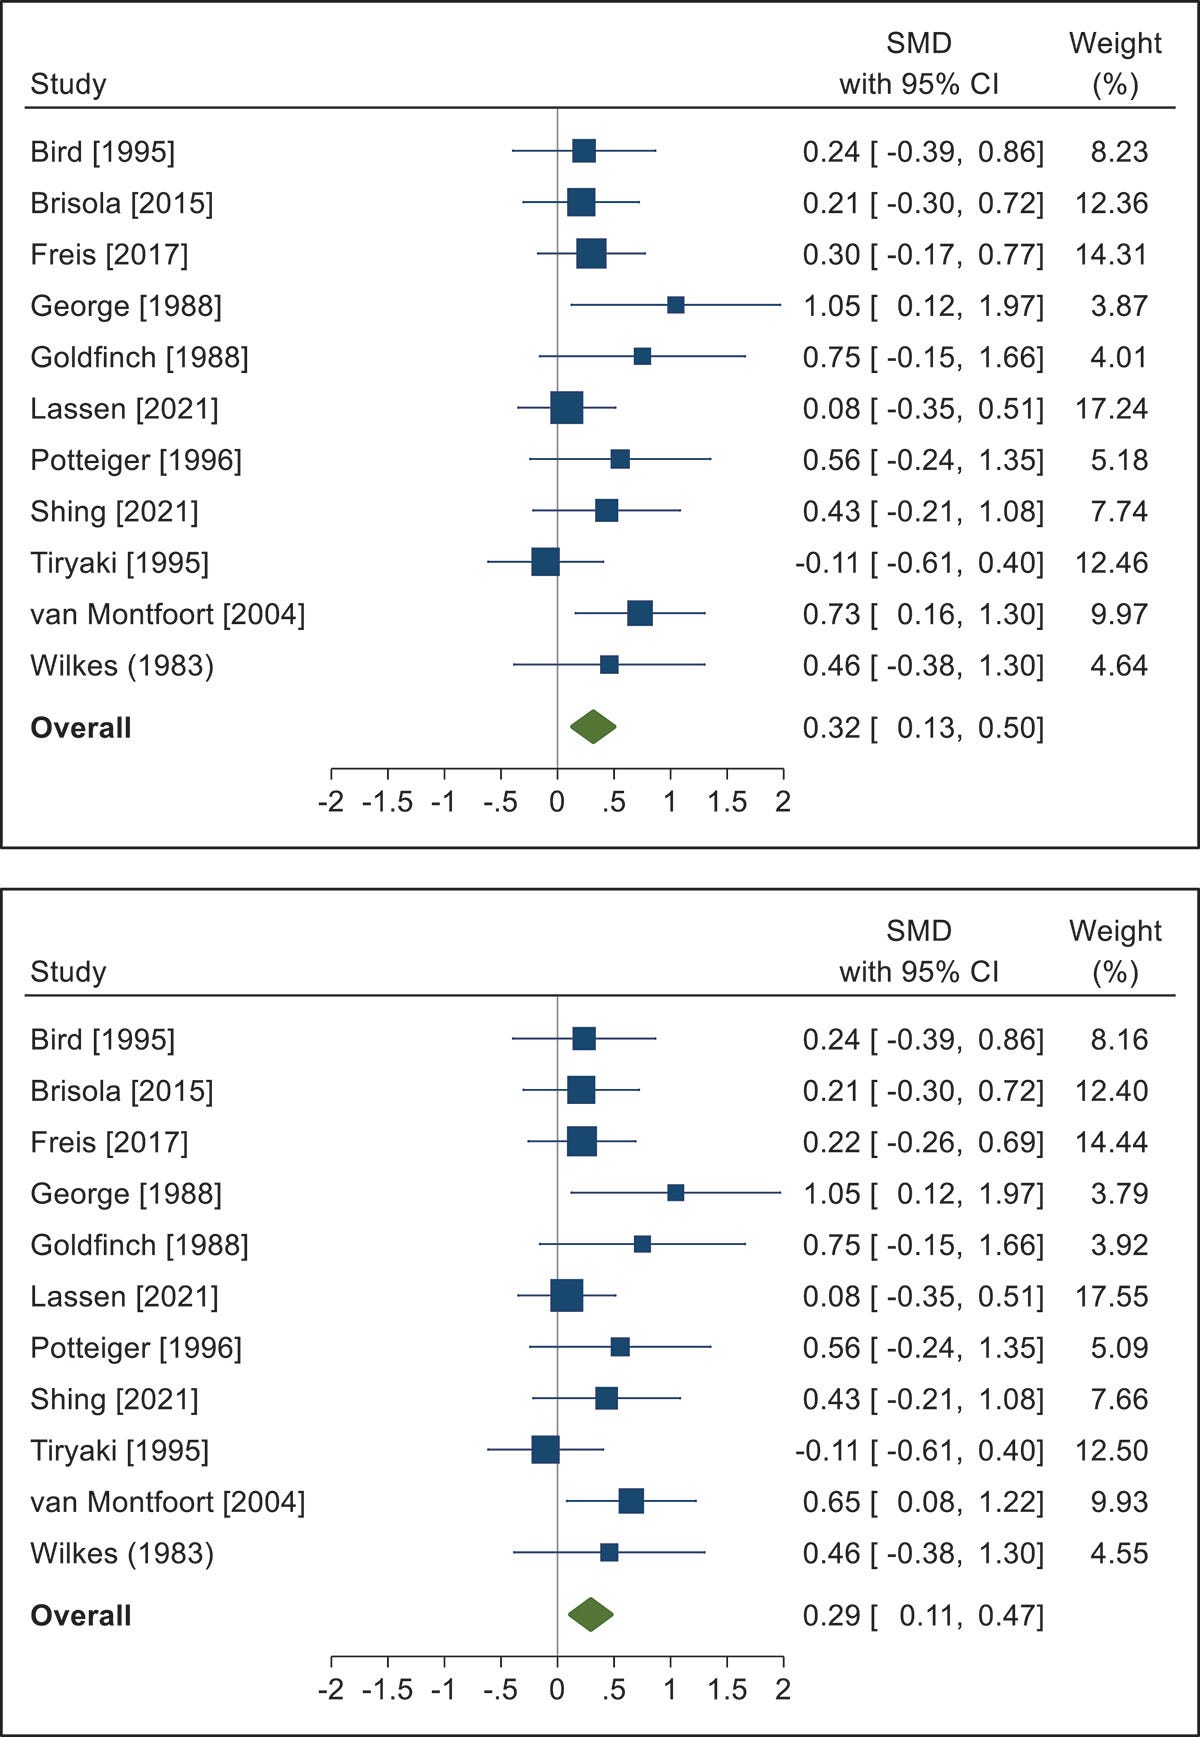
They ended up with 11 studies totaling 126 participants. Most subjects were men (84% male), generally young (roughly early 20s), and mostly trained/competitive runners. The dosing was typically 0.3 g/kg body mass (range 0.2–0.4 g/kg), usually taken ~90 minutes before the performance test. Performance tests ranged from 1 to 30 minutes and included fixed-distance time trials (like 400, 800, and 1500 meter runs), time-to-exhaustion protocols, a 30-minute maximal distance test, and a graded test.
Across studies that reported symptoms, GI issues occurred in 29.5% of bicarbonate trials versus 2.6% with placebo. And GI-related withdrawal (i.e., people who couldn’t complete the protocol) happened in 8.7% of bicarbonate conditions versus 1.6% with placebo. The most common complaints were diarrhea (9.0%), unspecified GI upset (9.0%), nausea/vomiting (6.4%), and stomachache (5.1%).
On performance tests, bicarbonate produced a small improvement overall. After adjusting for GI-related withdrawals (excluding people who “dropped out”), effects were still small. They also explored who might benefit more. Across studies, a higher proportion of male participants and a higher average body mass were associated with larger effects.
Practical takeaways
In the best-case scenario, the average benefit for sodium bicarbonate on continuous running performance looks tiny once you correct for the ways this literature tends to overstate effects, while the GI risk is very real (roughly a 1-in-3 chance of symptoms and close to 1-in-11 odds of not tolerating it at all). If you’re a larger male runner targeting shorter, very hard events (think a few minutes to ~15 minutes), you might be in the subgroup where it’s more likely to help, but even then you should treat it like any other high-risk strategy: test it in training, control the timing (~60–150 minutes before), don’t debut it on race day, and be honest about whether a small potential upside is worth the real chance of GI distress.
Can Your Watch Predict Your Sweat Rate?
I love wearables, but I’m also deeply suspicious of them, especially when they start spitting out numbers that feel medical (recovery scores, “training readiness,” and now… sweat loss). Sweat loss is one of those deceptively simple variables that’s hard to estimate without doing something unsexy like stepping on a scale before and after a run.
A new study asked if smartwatch sweat-loss estimates are accurate enough to guide hydration the way we’re starting to use them.
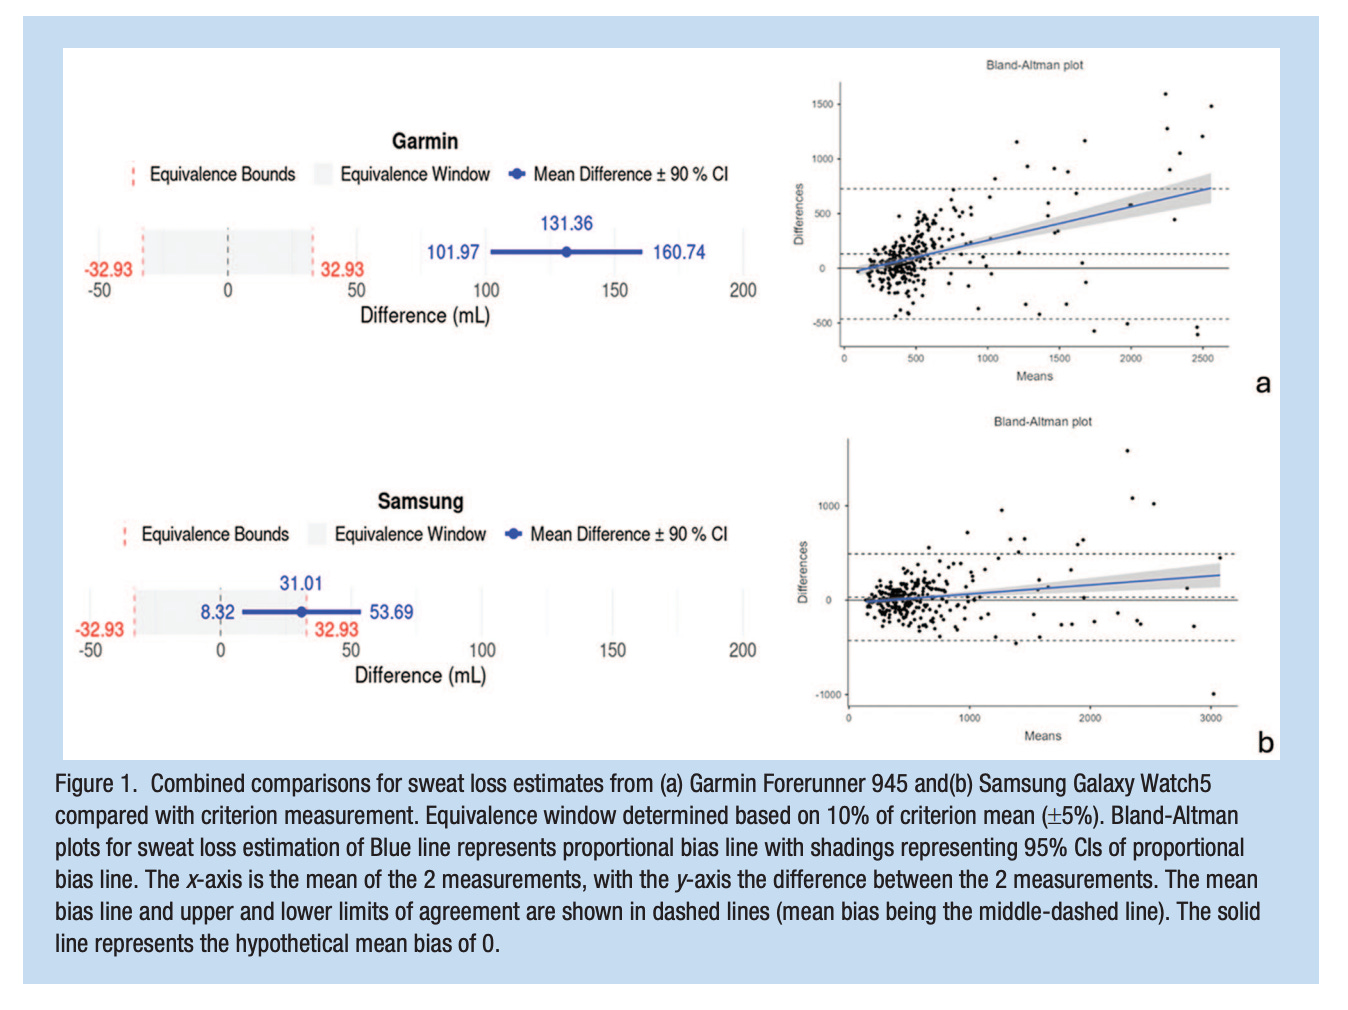
Researchers recruited 111 physically active adults (average age ~40; average VO₂max ~46.8 ml/kg/min) and had them complete up to four running visits. Everyone did an outdoor 5K and an indoor 5K, and then a third run that varied (2.5K, 10K, 20K, or an interval workout). In total, they collected 293 running trials, with 291 producing sweat-loss estimates from both watches.
Participants wore two popular devices at the same time: the Samsung Galaxy Watch5 and the Garmin Forerunner 945. The “gold standard” comparison was the change in nude body mass pre- vs post-run, converted to fluid loss, with strict rules about limiting fluid intake and bathroom use outside the exercise window.
Both devices tracked the general direction of sweat loss, but missed the actual amount by a lot.
Across all conditions, average sweat loss was ~659 mL, with a huge range (80 mL to 3,300 mL). Body mass loss ranged from 0.25% to 2.73%.
The correlation looked decent, especially for Samsung (0.90) and still “okay” for Garmin (0.77), meaning the watch’s estimations were generally in line with the direction and magnitude of actual sweat loss. But the error for the devices was high: Samsung’s average absolute percentage error was ~25%, and Garmin’s was ~33%. In plain terms: if you truly lost 1000 mL, your watch might reasonably tell you you lost ~670 mL… or ~1330 mL!
The absolute errors reinforce that point: average miss was ~151 mL for Samsung and ~218 mL for Garmin, but the more important detail is the spread. Samsung’s differences ranged roughly from ~428 mL under to ~491 mL over; Garmin ranged from ~464 mL under to ~727 mL over.
They also split the data by distance (short ≤5K, long ≥10K, and intervals) and environment (indoor vs outdoor). The headline didn’t change here, and the error stayed stubbornly high across conditions.
Practical takeaway
The authors’ bottom line is the one I agree with: these watches may be useful for trend tracking (am I generally sweating more this summer than in winter?), but they’re not precise enough to replace weigh-ins when accuracy matters. If you’re using sweat-loss numbers to guide a real hydration plan—especially for long runs, marathons, or hot conditions—treat your watch’s “sweat lost” as a rough guess, not a dosing chart. The average error here is big enough to push you toward underdrinking or overdrinking depending on the day. The better play is to do a few simple pre/post-run weigh-ins (same clothes, towel off sweat, track what you drank) to learn your personal sweat rate, then use the watch as a consistency tool to notice patterns (heat, humidity, pace, duration) rather than as the authority. Your scale is still the gold standard!
Thanks for reading. See you next Friday.
~Brady~
Ketone-IQ is high-performance energy in a bottle. I use it for post-exercise recovery along with enhancing focus, mood, and cognition. Take 30% off your order.

Create is the first “modern creatine” brand. They sell a wide range of creatine monohydrate gummies—and yeah, their gummies actually contain creatine, unlike some other brands. They’re giving my audience 20% off their order.

ProBio Nutrition—the all-in-one supplement that I use every single day—is offering 20% off. My preference is the tangy orange flavor, but they also sell an unflavored “smoothie booster” that’s great in a shake, smoothie, or juice.

Equip Foods makes some of the cleanest, best-tasting protein products around. I am absolutely obsessed with their Prime grass-fed protein bars (the peanut butter ones are to die for). Take up to 10% off site-wide and up to 35% off a subscription.

A lot of individuals are dairy protein sensitive. I wonder if they would have the same symptoms with a vegan protein powder in the shake??