Road to Boston Training Log | Race Recap!
Boston 2025 was an event to remember.
Thank you all for following this journey through to the end. It still blows my mind that tens of thousands of people (some strangers, some friends) returned weekly to read about my training for the Boston Marathon. I sincerely hope something I shared has helped you train smarter or harder—whether for Boston or otherwise. That’s really the goal! This post has two components: a video recap that I did with Marathon Handbook founder Thomas Watson AND a data-heavy section below for those who want to know splits, paces, heart rates, nutrition, and more!
I want to give one last huge shoutout to STRYD running pods who sponsored this entire 12-week training log. STRYD helps you harness cutting-edge power metrics and real-time insights to optimize every run, anywhere you train. They played a crucial part in my training and race success. This race recap contains plenty of data from STRYD!
The short of it: mission accomplished!
Race day went almost as good as it could have and I came away with a new personal best time of 2:24:26 and accomplished my goal of placing in the top 100.
Thanks for following along!
Race recap
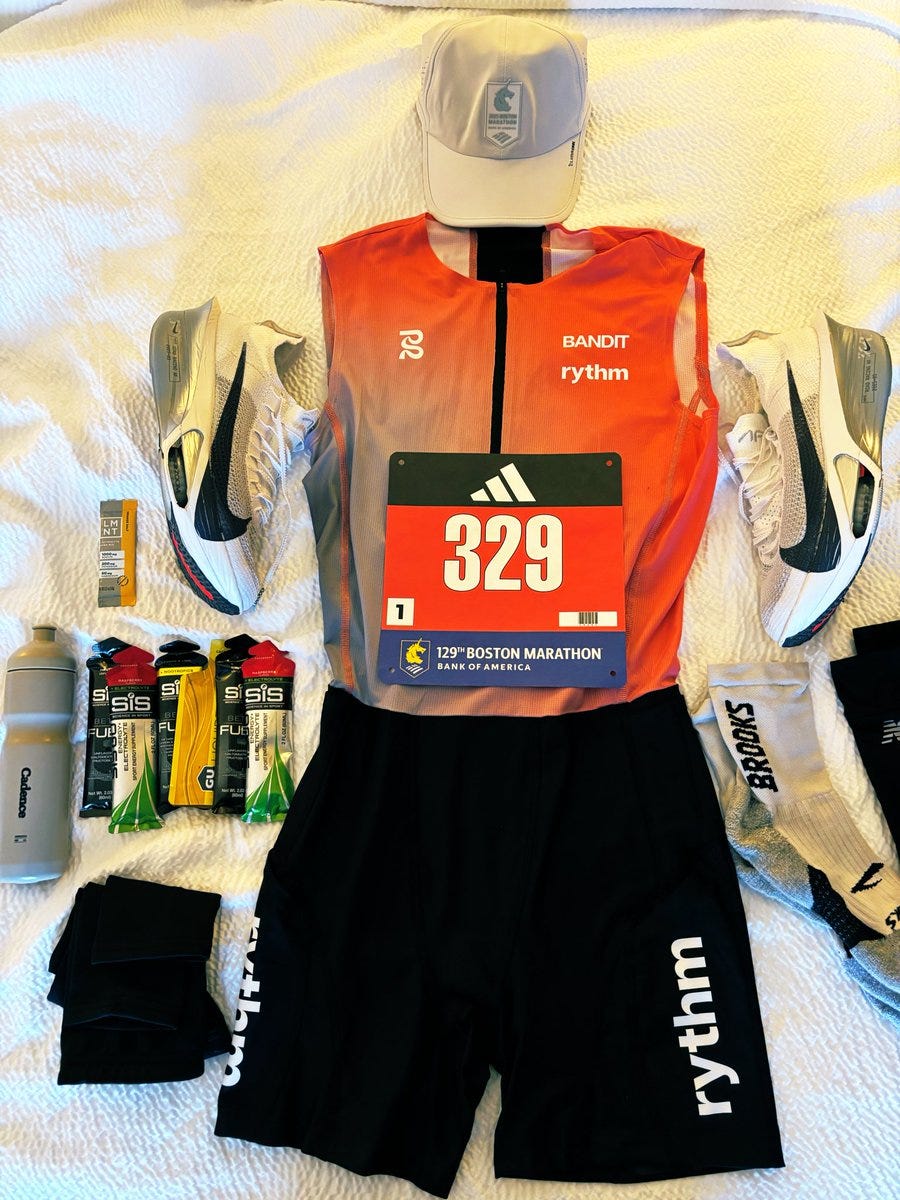
Shoes: Nike AlphaFly Next% 3
Breakfast: 1 bagel with peanut butter + water with electrolytes about ~3 hours before race start
In-race fueling:
Start line (20g - SiS electrolyte gel)
4 miles (25g - Gu liquid energy gel)
8 miles (40g + 200mg caff - SiS Beta Fuel nootropics gel)
12 miles (25g - Gu liquid energy gel)
16 miles (20g + 100 mg caff - Maurten gel 100/caf 100)
19 miles (40g - SiS Beta Fuel)
22 miles (20g - SiS electrolyte gel)
24 (~10g - 1/2 of SiS electrolyte gel)
That’s ~200 grams of CHO total or about 80g/hour
Hydration: I took water/Gatorade at most aid stations, but couldn’t tell you how much I had during the race.
Race stats
Stryd analysis
Here are some insights that the guys over at STRYD gave me from the race.
Very consistent pacing, continually within 1% variance in power throughout the race (taking into account higher air power at the end, 4% to 7%). Slight positive split speed-wise, but that's because the first half is net downhill and the 2nd half was windier. Heartbreak hills were closer to 10% variance in power (likely from running off pace/effort) but that's the only deviation point.
Solid durability. Leg spring stiffness (LSS) stayed within a 3% deviation throughout, even after the heartbreak hills. You only went out of that range when LSS increased as you increased power output to push the last couple miles. This means your legs were able to handle the load well and still have some good efficiency response to demand at the end.
Other efficiency/performance metrics like ground contact time (GCT) and VO/Form power either stayed within that 3% deviation from start to finish or improved (VO/Form power) during the final push.
Although your metrics stayed steady, you were hitting harder/loading more on your right side (47% L/53% R). Despite this, your LSS on your right side remained higher (48% L/52% R). This lends me to infer that your left leg might be slightly weaker/less efficient in general than your right; this is given that the right is out-performing the left despite the larger cumulative load.
As the race goes on you can see in your footpath (attached below) that your right leg stabilizes more to compensate (moves under center of mass) as the left leg has more and more wasted movement to the side.


Congratulations on an awesome Boston Marathon! I know you put in a lot of work and it paid off…….that is an amazing time and achieving a personal best on that course is quite the achievement.